
Debug Production Crashes with Visual Studio and GitHub Copilot
Production crashes can be difficult to diagnose when developers don’t have access to the application’s state at the time of failure. Microsoft has shared a practical walkthrough showing how Visual Studio can use memory dumps, Parallel Stacks, and GitHub Copilot to investigate application issues and identify potential thread saturation.
Here's how:
Capture a Memory Dump
Start by capturing a memory dump from the production application when an issue occurs. The dump preserves the application's state so it can be opened and investigated in Visual Studio.
Monitor the ThreadPool
Monitor how long tasks take to complete in the ThreadPool. If they exceed a defined threshold, the application can capture a memory dump for further diagnostics.
Reproduce the Problem
Try to intentionally overload the ThreadPool with long-running asynchronous tasks. As more tasks are added, the application becomes unresponsive, allowing the memory dump to capture the issue.
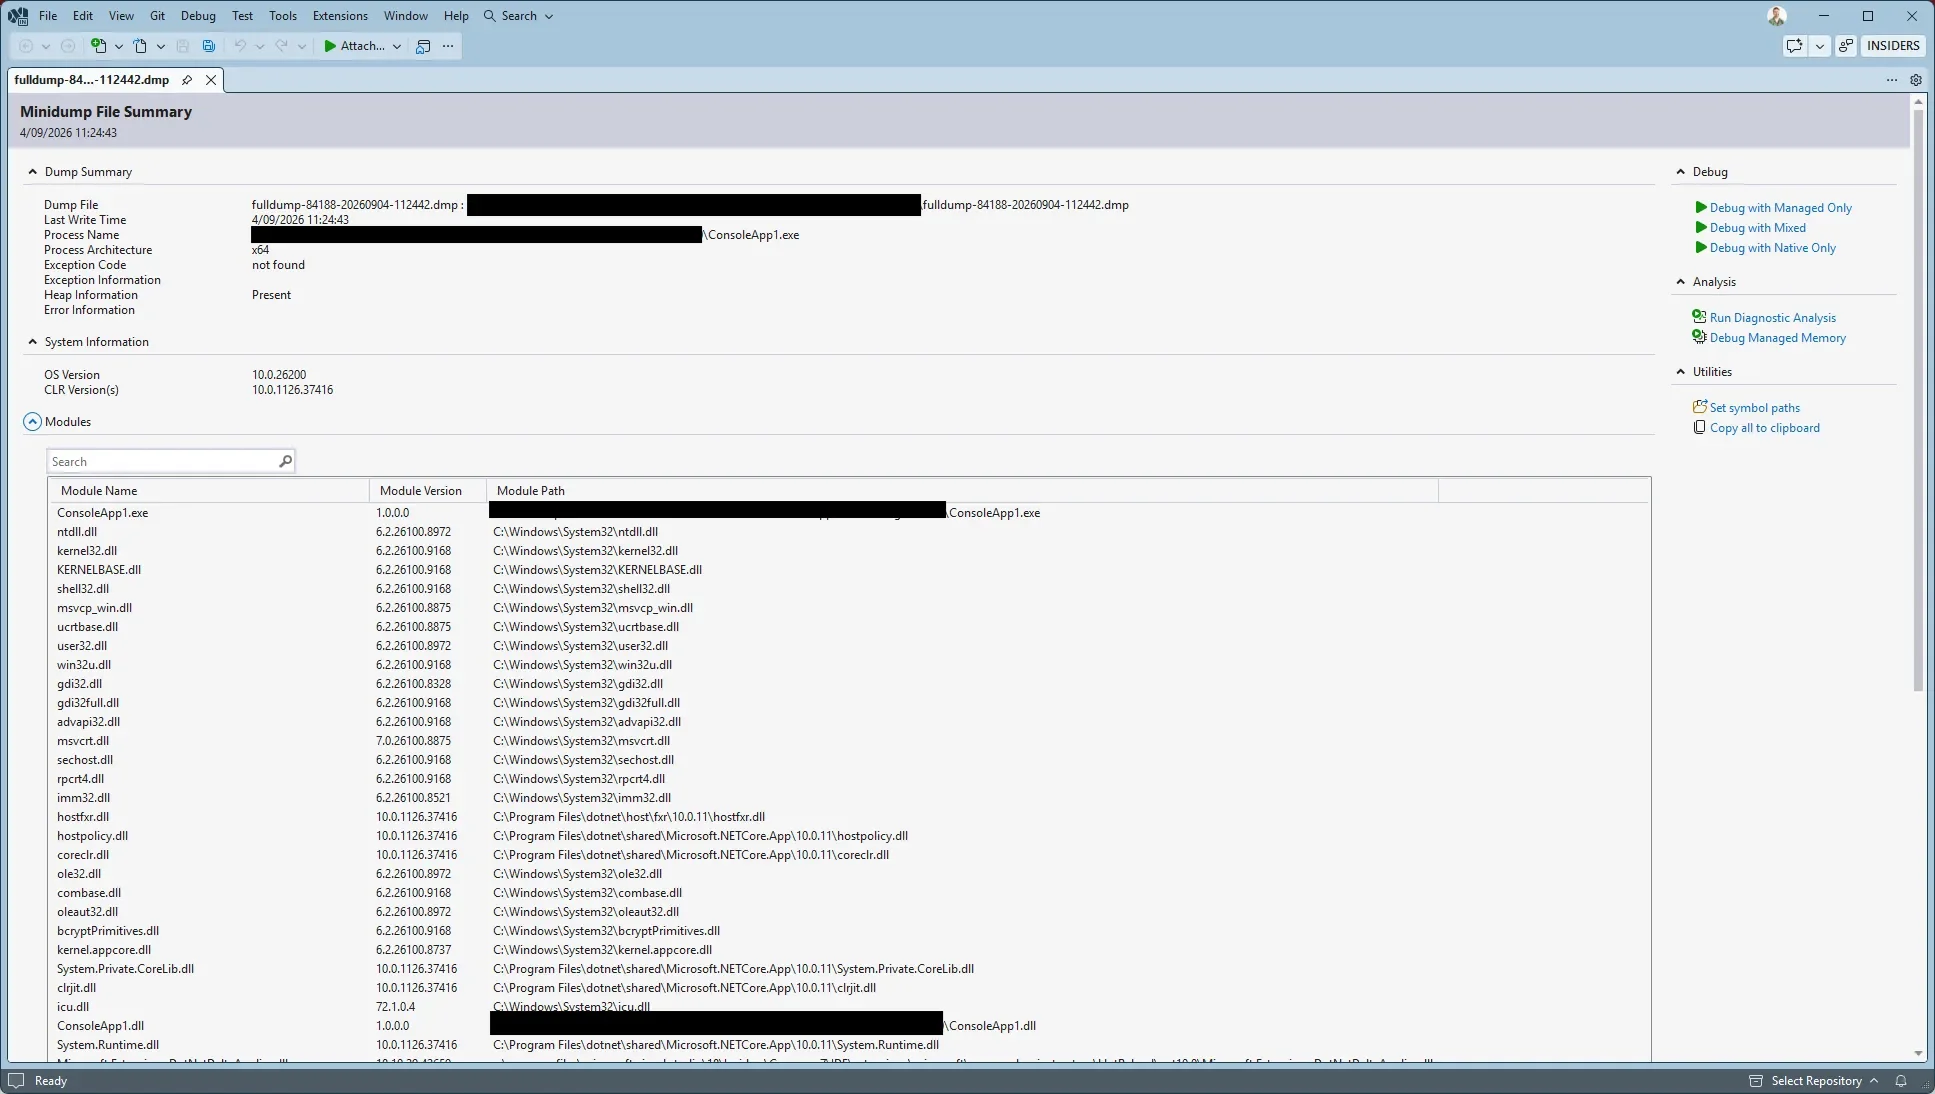
Open and Debug the Memory Dump
Open the .dmp file in Visual Studio and use Debug with Mixed to investigate both managed C# and native code. You can inspect the Call Stack, local variables, and other debugging information to understand what was happening when the application became unresponsive.
Analyse Parallel Stacks
The Parallel Stacks window provides a visual overview of the application's threads. By examining the threads and where they are blocked, developers can identify issues such as ThreadPool saturation and pinpoint where the application is getting stuck.
Analyse With GitHub Copilot
GitHub Copilot can work alongside the Parallel Stacks window to analyse thread states, stacks, and memory dump information. It can help identify potential root causes and suggest a path towards resolving the issue.
From Production Issue to Root Cause
Debugging production problems can be challenging when the application's state is difficult to reproduce. With Visual Studio, memory dumps, Parallel Stacks, and GitHub Copilot, developers can investigate what happened and gain deeper insight into issues affecting their applications.
Get the answers you need about your system without always relying on your coworkers. Explore System Knowledge Assistant and contact us today to get started.
